Publications
 Partners


Over the last decade there have been significant decreases in the rates of new HIV infections, HIV-related deaths, and mother-to-child transmission (MTCT) in South Africa. Yet, there are still staggering gaps between different subsets of the population. Using estimates from the Thembisa mathematical model of HIV in South Africa, we produced the following seven graphs to explore some of these nuances. Thembisa is the official source for UNAIDS’s HIV estimates for South Africa.
HIV Incidence in Young Women and Girls (Aged 15 to 24) vs. Young Men and Boys (Aged 15 to 24)
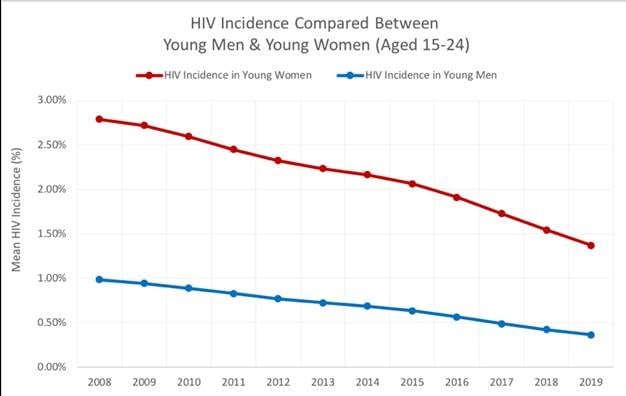
HIV incidence is the percentage of individuals in a population that have newly contracted HIV in a particular year. While the total incidence rate for the country is slowly coming down, there are interesting variations in incidence in various sub-groups. Of particular interest is the rate of new infections in young women and girls aged 15 to 24.
This graph shows the incidence from 2008 to 2019 in young women and girls aged 15 to 24 (Red Line) compared to young men and boys in the same age group (Blue Line). It is clear from the graph that incidence in women and girls in this age group has constantly been higher than that in boys and young men.
In 2019 young women and girls still have an estimated incidence of 1.37%, around four times the estimated incidence of 0.36% in young men and boys. In absolute terms, this amounts to around 58 000 infections in young women and girls in this age group for 2019 compared to around 17 000 in young men and boys.
HIV Incidence in Young Women and Girls (Aged 15 to 24) vs. Older Women (Aged 25 to 49)
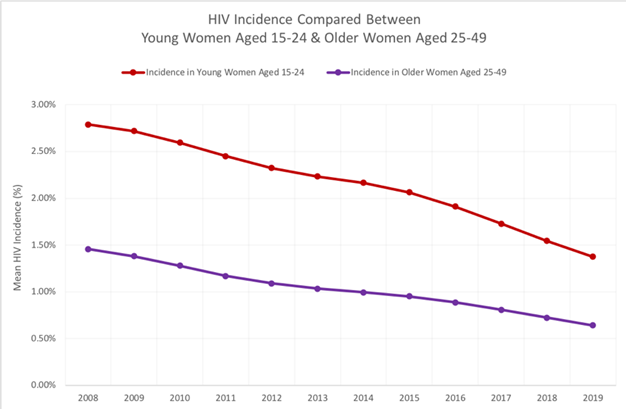
A woman's risk for acquiring a new HIV infection changes with age. The graph above shows the difference in incidence between young women and girls aged 15 to 24 (Red Line) and older women aged 25 to 49 (Purple Line) over the time period from 2008 to 2019.
In 2018 young women and girls had an estimated incidence of 1.54%, whereas older women had an estimated HIV incidence of 0.72%. In absolute terms this amounts to around 66 000 new infections in young women and girls and around 54 000 in older women in 2018. When considering the absolute numbers, it is worth keeping in mind though that there are more women in the age 25 to 49 age group than in the 15 to 24 age group and that this fact limits the value of straight comparisons.
Either way, these first two graphs make it clear that helping young women and girls stay HIV-free is an area that requires urgent attention.
Rates of Condom Use
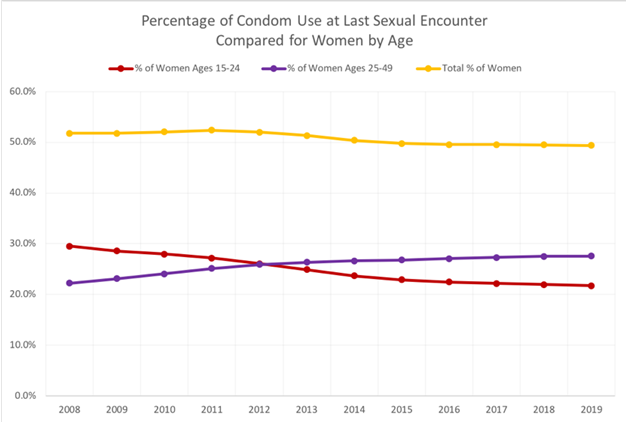
This graph shows the percentage of condom use at last sexual encounter in young women and girls aged 15 to 24 (Red Line) and older women aged 25 to 49 (Purple Line)) from 2008 to 2019. Older women are clearly more likely than younger women to use condoms, but the percentage is levelling off.Of particular concern is that condom use in young women and girls appears to be decreasing steadily. It is estimated that in 2019 only 21.8% of young women and girls used a condom at their last sexual encounter.
These numbers suggest that access to condoms and public awareness of the importance of safe sex should again be prioritised. With increasing condom use and knowledge on safe sex, there could be a decrease in HIV infection incidence and prevalence in this population. This also strengthens the case for comprehensive sex education in schools and making condoms easily accessible to learners.
The picture is also not very encouraging if you look at these two groups combined, i.e. women and girls aged 15 to 49 (Yellow Line), only 49.4% of women in this broader age group are estimated to have used a condom the last time they had sex.
Getting Tested: Women vs. Men on Reaching the First UNAIDS 90-90-90 Target
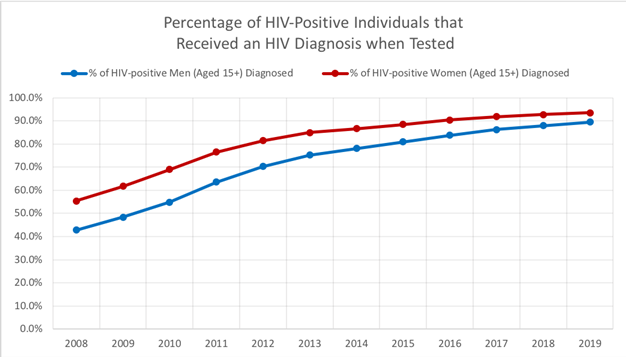
The first UNAIDS 90-90-90 target states that by 2020 90% of people living with HIV should know their HIV status by receiving a positive HIV diagnosis. This graph shows the percentage of men aged 15 years and older who have been diagnosed with a positive HIV status (Blue Line) and women aged 15 years and older with a positive HIV diagnosis (Red Line) between the years 2008 and 2019.
While there has been a steady increase in the percentage of people living with HIV who know their status, there has also been persistent differences between men and women – with men being less likely to get tested for HIV and the percentage of men living with HIV who know their status accordingly being lower than the percentage in women.
Diagnosed and on ART: Women vs. Men on Reaching the Second UNAIDS 90-90-90 Target
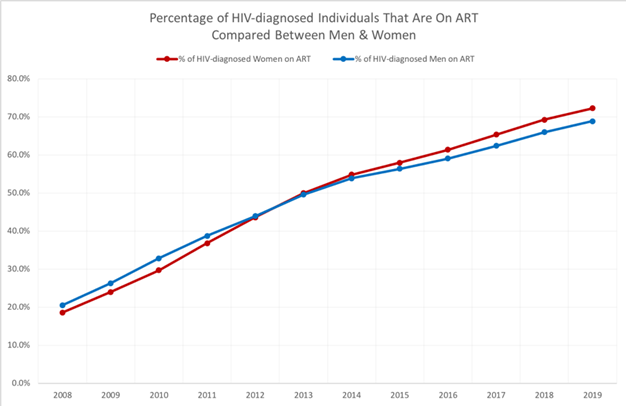
The second UNAIDS 90-90-90 target states that by 2020 90% of all individuals who have been diagnosed with HIV will be on sustained antiretroviral therapy (ART). This graph shows the percentage of HIV-diagnosed men who are on ART (Blue Line) and women (Red Line) from 2008 to 2019. Both groups are well behind the UNAIDS target of 90% of HIV-positive individuals being on sustained ART and neither group, nor men and women combined will make the target by the end of 2020.
That said, the rates of people on ART have increased dramatically over the last decade, more so in women than in men. In 2018 66% of men were estimated to be on sustained ART, whereas women were at 69.3%. In terms of absolute numbers, around 296 000 women were estimated to have newly started ART in 2018 and 168 000 men.
The above two graphs show that men are both less likely to get tested for HIV and less likely to start taking treatment if they test positive. While there is some research on why men are less likely to engage in care, more research is warranted. It might also be a good idea to systematically trial different interventions aimed at engaging men in care and then scaling up those that are showed to work best.
Reduction in MTCT Rates Over Time
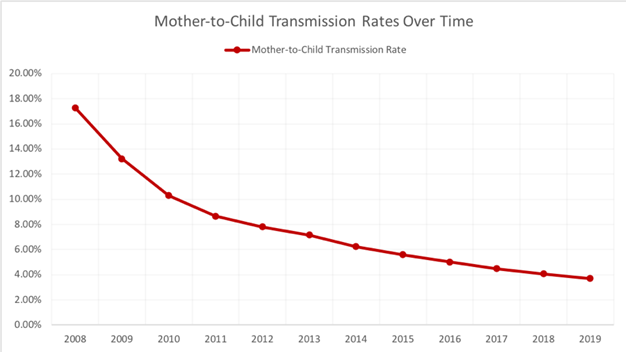
Over the last two decades MTCT rates have declined dramatically, yet transmission of HIV from mothers to their babies is still occurring. These graphs outline some nuances of MTCT in South Africa.
The first graph above shows the overall mother-to-child transmission rate for the period from 2008 to 2019. It clearly shows the remarkable impact that the provision of ART to pregnant women living with HIV has had in reducing transmission. In 2018 there was an estimated MTCT rate of 4.06% in South Africa compared to 17.28% in 2008.
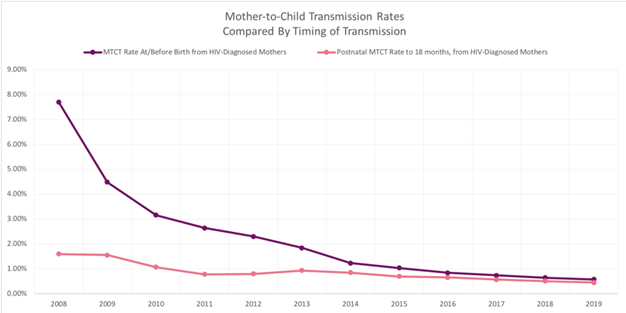
This second graph untangles the MTCT rate based on the timing of transmission to the child. The purple line shows MTCT at or before birth from an HIV-Diagnosed mother, whereas the pink line shows the Postnatal MTCT rate to 18 months from an HIV-Diagnosed mother. In 2018 there were around 251 000 births to HIV-positive mothers in South Africa, with 10 196 new cases of MTCT.
This equates to the estimated 4.06% transmission rate between mothers and their children. More specifically, 2 559 of these transmissions took place at or before birth, whereas 7 637 cases were due to breastfeeding. One possibility for this is that many women become HIV positive after giving birth and then transmit HIV to their babies while breastfeeding.
Children Living with HIV
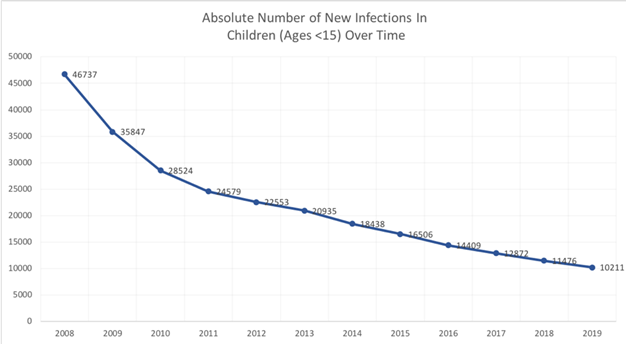
This graph shows the change in absolute number of new HIV infections in children that are under the age of 15 from 2008 to 2019. Even though these numbers have been coming down impressively, there were still over 10 000 new HIV infections in children in 2019. Thus, even in 2020, the time of children contracting and living with HIV is clearly not over.
READ | Large-scale HIV vaccine study failed, but there's hope
READ | Government plans massive PrEP rollout
READ | 7 things you should know about HIV, but probably don't
*This article was produced by Spotlight – health journalism in the public interest.